Relation between Yield Curve and Net Interest Margin of Banks
From here on yield curve is expected to bull steepen. So banking stocks may rally!? Read below.
Traditionally it is argued that yield curve and banks’ net interest margins share a logical relationship. Banks pay interest on their deposits based upon short-term interest rates while making loans tied to long-term interest rates. Thus, the difference between interest paid and received, which is the net interest margin, should be influenced by the slope of the yield curve, defined as the spread between short term and long term interest rates. The international discourse in this matter has been supported historically through 1984 and 1994 when the correlation between changes in the yield curve spread and banks’ net interest margins with a two-quarter lag worked out to be 70 per cent. This relationship between yield curve and net interest margin is important from a macroeconomic point of view given the fact that a flattening yield curve is a precursor to a slowing economic growth and consequently increased pressure on banks’ earnings. However, of late, banks have become less sensitive to yield curve movements for several reasons. One, this may be attributed to changing banking regulations and product differentiation which has enabled banks to diversify into non-traditional activities. Two, exposure to interest rate movements have been moderated through the development of new financial products such as interest rate swaps, securitization and adjustable rate loans. Three, banks have been able to offset the impact of declining yields on net interest margins of banks by funding more of their assets through non-interest bearing liabilities such as equity and demand deposits. Another interesting observation has been that although net interest margins of large banks have moved in consonance with the yield curve movements, small banks have exhibited signs of decoupling from the prescribed trend of the yield curve. This may be attributed to differences in asset composition and funding costs between small and large banks.
Large banks specialize in commercial and industrial loans which have experienced decline in rates charged because of competition from both bank and non-bank sources. Secondly, larger banks have experienced a rapid rise in funding costs due to their greater reliance on overnight and wholesale funding which are repriced faster during an upward revision of interest rates. This is as opposed to smaller banks which rely more on long term deposits.
In the case of India, there has been flattening of yield curve with yield spread (between 1 year and 10 year Government securities) contracting from 3.22 per cent in 1996-97 to 0.72 per cent in 2006-07. The reason for this was the decline in long term rates and relative stability of short term rates as inflationary expectations remained well-anchored. The NIM has been following yield spreads with a lag possibly because lending and deposit/borrowing rates do not get adjusted to the market movements instantly. Correlation between yield spread and NIM with a one year lag was around 0.68 (Chart).
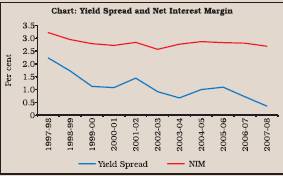
Source: Efficiency, Productivity And Soundness of The Banking Sector
Banks have already rallied much in 2012. Also one should factor NPA issue while considering above NIM relation with yield curve.
More about Kush Sonigara on Google+
