Archive for the ‘Debt Mutual Fund’ Category

Nominal GDP & Tax Collection Target Ambitious ; Net Borrowing In-line With Expectation

Key points:

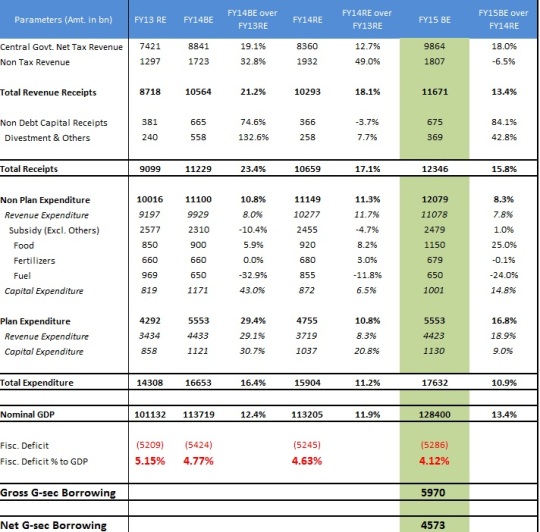
  • The fiscal deficit for 2013-14 is contained at 4.6 percent and to be contained at 4.1% in FY15.
  • The current account deficit is projected to be at USD 45 billion in 2013-14 down from USD 88 billion in 2012-13.
  • Foreign exchange reserve will grow by USD 15 billion in this Financial Year.
  • Food grain production estimated for the current year is 263 million tonnes compared to 255.36 million tonnes in 2012-13.
  • Through the Direct Benefic Transfer (DBT) Scheme, a total of 628 crore (54,20,114 transactions) has been transferred directly to the beneficiaries till 31st January 2014 under 27 Schemes.
  • The Excise Duty on all goods falling under Chapter 84 & 85 of the Schedule to the Central Excise Tariff Act is reduced from 12 percent to 10 percent for the period upto 30.06.2014.
  • 10 per cent hike in Defense allocation has been given in comparison to BE 2013-14.
  • 11,300 crore is proposed to be provided for Capital infusion in Public Sector Banks.
  • Public Debt Management Agency Bill is ready with the Government. It is proposed to establish a non-statutory PDMA that can begin work in 2014-15.

Our Take

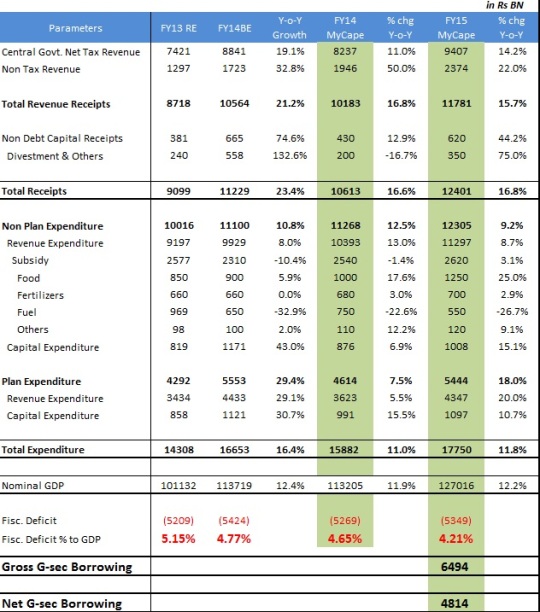
Finance Minister P. Chidambaram has kept up his promise to keep the deficit within the most reiterated red line of 4.8%. However the means by which he minimized the deficit is well known i.e. by rolling over the subsidy payments in the following year. Bond markets were more closely eyeing gross and net borrowing number which more or less were in line with market expectation however many doubt whether the same will be adhered to given high probability of India having someone else managing the finance ministry ahead. Demand supply dynamics at a net borrowing number of ~4.6tn seems favorable however above statement of increasing the FX reserves by USD15bn and RBI’s bias towards low SLR may dampen initial calculations. It wouldn’t be surprising if debt return outpaces equity in the next one year hereon.

Weak demand and reduced tax rate make the tax collection projections tad optimistic. The most watch and worrying factor, subsidy, is planned for INR 2.47lk cr. However unnatural movement in Oil and Fertilizer prices may bring up uncomfortable numbers.  FM pegged FY15 growth at 5% and nominal growth at 13.4% which tentatively prices in an inflation (precisely GDP deflator) of 7.6%.  Bond market’s reaction to budget is that of a non-event. Going forward, Fresh issuance & switch (500bn) calendar in addition to inflation and domestic currency will guide the markets.
fiscal updateMore about Kush Sonigara on Google+


FY15 Borrowing and Fiscal Estimates

Borrowing

I am working with a gross borrowing of ~6.50tn. However note that I haven’t considered cash balance which government will carry next year. Cash balance may range anywhere between 400-550bn. Hence gross borrowing then, excluding cash balance, should come down to 5.95-6.1tn.

Gilts of ~1.68tn will mature in FY15. Incorporating redemptions, net borrowing should come at around 4.8tn. Conventionally RBI raises 90% of its net borrowing via Gsec. Hence total net Gsec supply could come at around 4.3-4.4tn considerably low vs. 4.69tn of net borrowing in FY14

Note – I haven’t incorporated switch effect anywhere above. If government, which had already bought ~120bn of FY15 debt, switches ~200bn by FY14 end then above figure of 4.3-4.4tn for net supply should fall by similar amount i.e. 200bn to 4.1-4.2tn.

I would add duration at current levels however on an incremental basis with a minimum 2 year horizon.

More about Kush Sonigara on Google+
Seasonal Lean Period of Banks (Benefits of Buying CD in March)

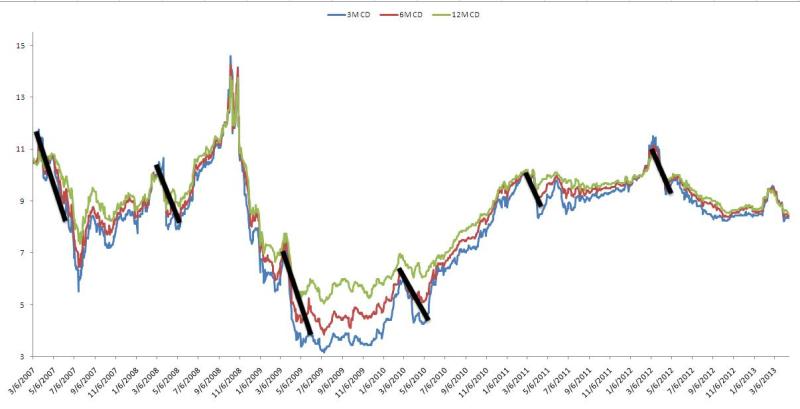
Lean season is present in almost all sectors barring healthcare and food Industry. Banks too have to go through lean season where lending slows down but deposit continues to grow. First quarter and some extended part thereon is the lean season for banks when corporates borrow less. This indeed improves cash balance with banks and hence banks reduces their CD issuances significantly post March end. Then arises a situation when demand for funds is low which subsequently leads to fall in short term rates.  Below is the chart where one can understand the lean period effect highlighted by thick black bars.

Falling Short Term Rates

How do fund managers benefit from this seasonality?

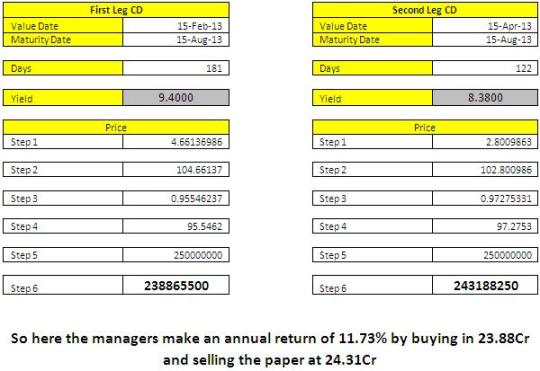
Fixed Income Fund Managers by February end starts switching their portfolio from G-sec to short term papers . CD rates are high during Feb end and whole of March. They buy papers at high yields and sell the same in May-June at a lower yields benefiting from capital appreciation. No doubt there arises a risk of reinvestment for the fund managers but most of them start moving to G-sec/Long corporate papers as by April-May supply premium would have already been priced and rates should be on the verge of a fall on account of OMO expectation.

CD CP Return March April

More about Kush Sonigara on Google+
G-sec corporate bond spread in first half of calendar year

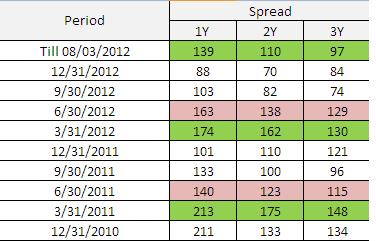
It is the month of Jan, Feb and March when CD issuances rise manifold. Corporates demand funds from banks for working capital requirement. Corporates also buy funds for plant and machinery to enjoy depreciation benefit. Hence banks fall short of money and raise funds via bulk deposit at higher rates amid tight liquidity for funds. Short term rates rises so it is well understood that banks won’t borrow funds at 8.5-9.5% to invest in bonds yielding nearly same return. This reduces demand for corporate bonds and hence spread widens substantially. Soon as and when liquidity improves (which brings down short term rates as well) spread narrows.

Spread

More about Kush Sonigara on Google+
Valuation of Illiquid G-sec/SDLs

Volume of G-sec is just ~1% of total outstanding Debt i.e. ~30000Cr of 30,00,000Cr outstanding debt. It is also knows that volume is more concentrated in top five liquid papers. Out of ~90Gilt papers only 15-20 are traded daily. There are few which haven’t been traded from many days and months. So how to value this illiquid securities. FIMMDA on a daily basis upload daily price of each G-sec/Floating paper and SDLs using Cubic Spline Valuation method.

Read FIMMDA circular on valuation

Below is the link to download daily price for G-sec and other papers.

http://www.fimmda.org/download/bloom/U28022013.xls.aspx

The reason why I have highlighted 28022013 is because you will have to tweak the link address to match with required date valuation. Above link is for 28th Feb 2013 valuation sheet. This helps one to understand at what price is RBI going to buy bonds (via OMO facility) if at all it announces to purchase illiquid securities.

More about Kush Sonigara on Google+
Budget, Gross Borrowing & Net Borrowing Expectation

Budget Expectation – Download Sheet

Appreciate your inputs!!

More about Kush Sonigara on Google+

Factors affecting money market rates {Excel on CBLO-CD allocation attached}

Money market rates move in tandem with liquidity condition in an economy. As far as India is concerned major factors affecting liquidity are
• Currency in circulation
• Government cash balance
• Credit Deposit Growth differential
• Open Market Operations
• FX intervention (spot markets)

Liquidity deficit is structural in nature. Every quarter end heavy chunk is sucked from the system on account of advance tax outflows. Liquidity also marginally gets worse every month end/start as currency in circulation increases on account of salary draw down  Sale of govt. resources also affects liquidity due to cash outflow. Situation of liquidity going forward can be to some extent easily analyzed contemplating above factors. Normally in the month of February and August end fund managers sit on cash awaiting better yield CDs as tight liquidity and heavy supply increases the yield of short term papers. Now they probably work on whether to invest in CD right away at 9.05 %( hypothetical) or wait (i.e. invest in CBLO synonym to cash @7.75% [near to RBI’s REPO rate]) for few days and pick same maturity CD at 9.25%.

Below is the excel sheet wherein one can contemplate and see if it’s better to lock in money in a CD right away or wait for sometime placing the same cash in CBLO.

Download – Money Market Investment Decision

Examples performed

If CD rates after 20days are expected to be at 9.40%. Currently CD is at 9.05%. CBLO is at 7.75% then probably it is better to get into CBLO for 20days then invest in CD @9.40%. Annualized yield would then be 2bps higher comparatively.

If CD rates after 25days are expected to be at 9.40%. Currently CD is at 9.05%. CBLO is at 7.75% then probably it is better to get into CD right away at 9.05%. Annualized yield would then be ~6bps higher comparatively.

Appreciate your inputs…

More about Kush Sonigara on Google+

Investment Guidelines for Banks, Provident Fund and Retirement Fund

SLR also known as Statutory liquidity ratio is quantum of minimum allocation of funds in G-sec , SDLs and other approves securities.

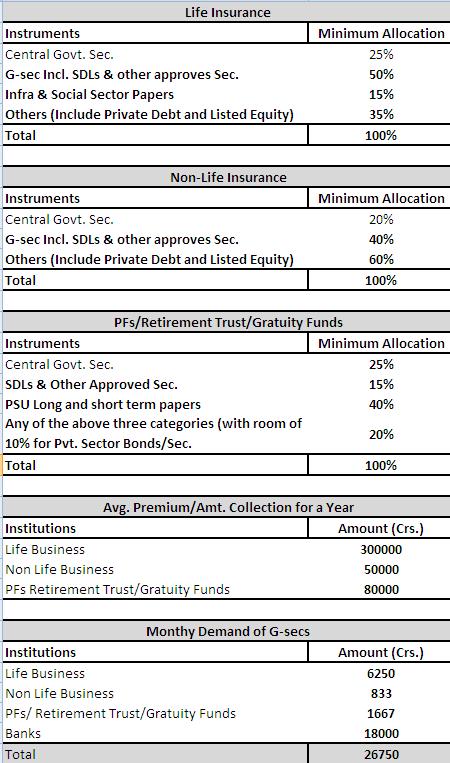
Banks, PF and Retirement Trusts are mandated to invest particular specific amount into above mentioned instruments. Banks SLR allocation is very much discussed hence one can always come to know whenever it is tweaked. Below is the data I gathered on Investment norms for PFs and Insurance Companies. I hope it’s accurate. I would appreciate your inputs.

G-sec Demand_Investment Norms

Above figures are not accurate. But one can say near to actual. One should also keep in mind that it is not necessary that above four borrows every month captioned amount. They sometimes may be sellers for some period and then buyers in bulk the other month. Hence what we can see is that above institutions has the capacity to consume ~300000-350000cr of G-sec.  Net borrowing via G-sec for 2012-13 is seen at ~480000Cr. Rest is taken care by RBI’s OMO, PDs (Underwriters) and FIIs.

More about Kush Sonigara on Google+

Fixed Income Portfolio Management – Excel Solver

Let’s try and understand something very basic in Fixed Income Portfolio Management. I am not an expert or a fund manager so it may have some subjective issues.

Bond Portfolio – Download the Sheet

Area marked in brown is to be edited. Though there is provision for only 9 instruments in attached excel, one can extend the cells to the right making a note that all formulas are then updated respectively. There are income funds which have a mandate to keep the maturity profile of the fund limited to some number. For. E.g. Birla Dynamic normally keeps the duration near to 3. So how does one keep constant watch on it? How does one optimize return with respective duration? How should one allocate his funds to enjoy maximum convexity other things (i.e. duration, yield) remaining constant. How can one optimize returns of the portfolio following risk mandates like maximum allocation to one security should not be more than 30%, maximum in Gsec should not be more than 50%, etc..

Yes excel solves every above mentioned aspect. “SOLVER” is an optimizer tool which helps you generate better results with in hand parameters.

In the attached sheet I have highlighted two tables i.e. “USE SOLVER HERE” and “SOLVER PARAMETERS”. One will have to work on the above tables once bonds/NCDs/other papers information is entered in the brown cells. Let’s try out one case which will help you understand in a better way.

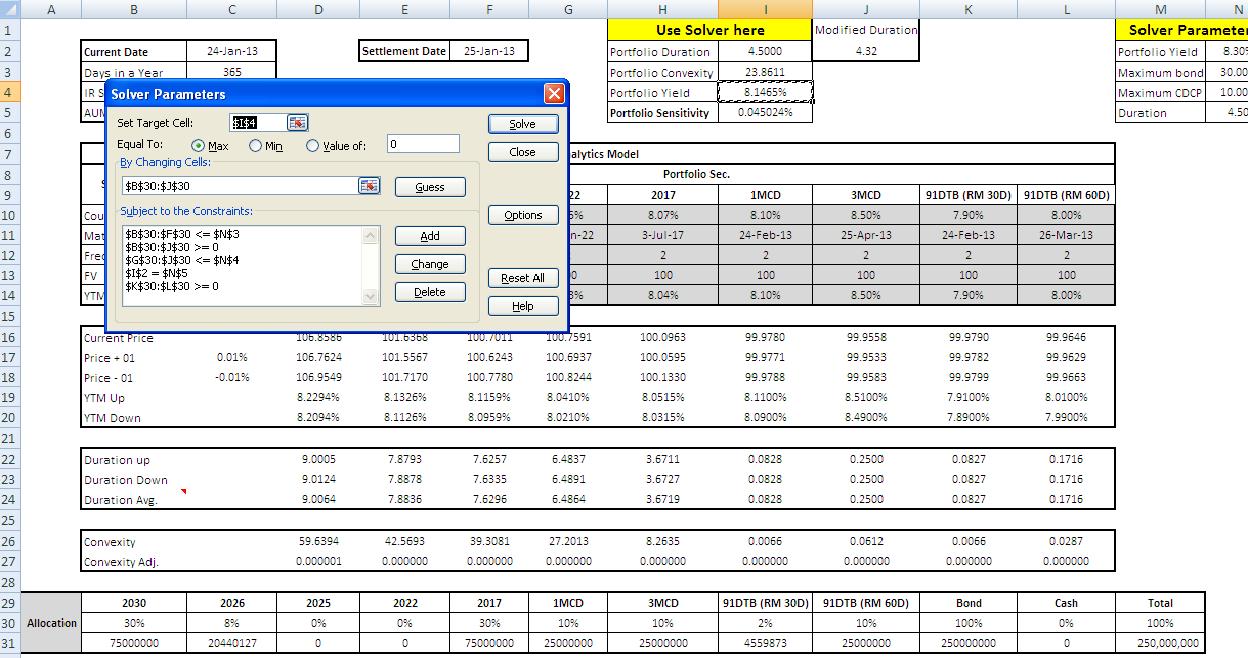
 Demo1

Now using solver tool we are asking excel to return us the best portfolio allocation to get maximum yield keeping some parameters in mind. Just to understand one conditions we have specified is that $B:$30:$F$30<=$N$3 i.e. Any gilt paper should not exceed 30% of the portfolio value.

If I was not using Solver than probably would randomly allocated money to papers available keeping mandate in mind.

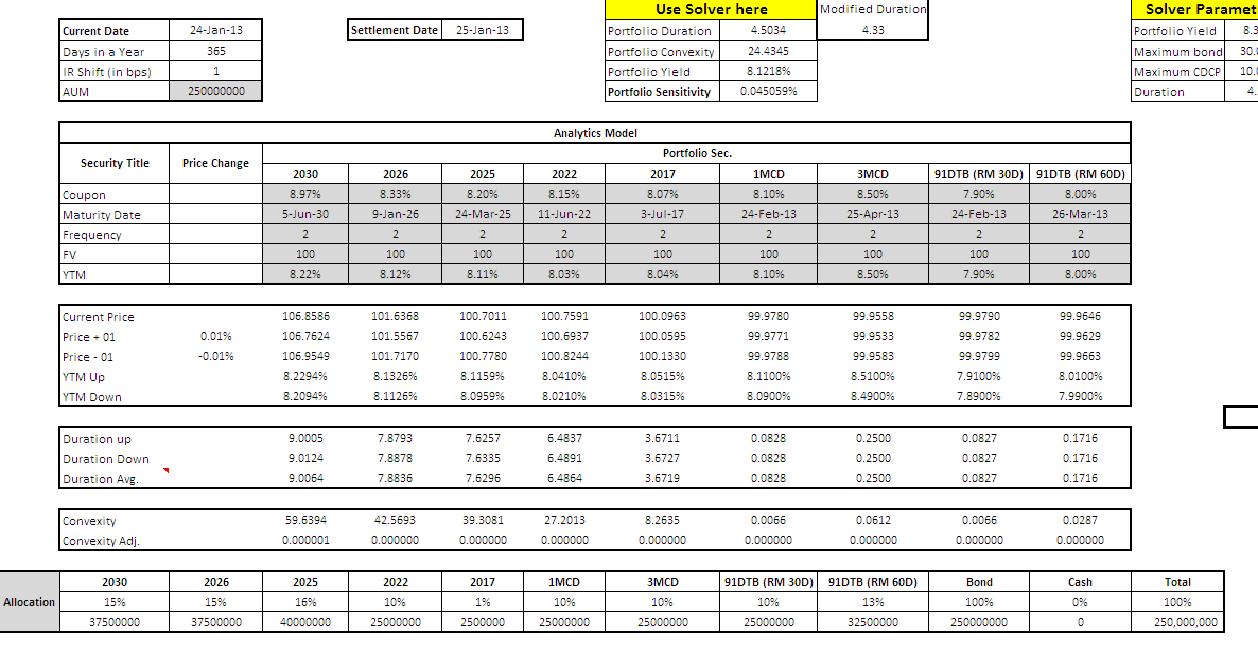
 Demo2

This could have been one of the results. Yield here is tad low than optimum yield possible.

Hence one performs optimum adhering to mandates of the scheme using solver.

Appreciate your inputs…

More about Kush Sonigara on Google+

Off the run and on the run bonds (with brief on new 10yr Issuance)

We normally hear experts citing few papers (bonds) as either on the run or off the run. Now let’s try and understand what it means…

Government raises fund by issuing bonds. This bond can either be newly issued or by issuing additional paper of already issued bonds. E.g. If government wish to borrow 100rs with 5yr maturity and 100rs with 10yr maturity then it will first prefer already issued or say available paper maturing in 2017(currently 2012+ 5yrs) and 2022 (currently 2012+10yrs). If let’s say govt. finds 2017 paper which they previously issued but do not have any paper maturing in 2022 than it would raise 100rs by issuing same 2017 security with same coupon and 100rs by issuing a new 10yr Gsec.

Most recently or newly issued papers are said to be “on the run” papers. Hence in our example 2022 security will be seen as on the run paper. On the run paper is considered to be very liquid as RBI (Central Bank) keeps issuing more papers of same bond to fulfill governments requirement. There exists some limit after which a new paper is issued. i.e. Once the 2017 paper outstanding rises above 65000-75000Cr government avoids raising fund using the same paper rather they prefer either issuing new security. Now when this 2017 paper outstanding amount reaches stipulated amount then it is termed as off the run paper. As soon as the outstanding of any particular paper rises to 60000cr that particular paper is avoided by the participants or they price the bond keeping illiquidity in mind. i.e. let’s say 10yr Gsec 2022 is trading at 8% as on 01-Apr-2013 and government is planning to issue a new 10Yr (2023) within a week or so then New G-sec is expected to have cut off yield at ~7.80%-~7.85% (Note: After 2023 issuance, 2022 paper will be defined as off the run paper and 2023 will be on the run). The reason being participants are aware that once 2023 papers comes into existence trading volume in 2022 will reduce significantly hence in price terms they expect discount.

In a falling yields scenario if you see 10yr G-sec is falling less compared to other top traded papers than probably that particular 10yr paper outstanding amount may have reached 60000Cr. As discussed above 60000cr market starts pricing in illiquid discount i.e. It demand high yield as the then 10yr will become off the run in a short while after which it is assumed to turn  illiquid.

Some historical fact on 10 Yr G-sec new issues

2010

Previous 10Yr

New 10Yr

Date

Yield

Date

Yield

29-Apr-2010

8.09

30-Apr-2010

7.80

2011

Previous 10Yr

New 10Yr

Date

Yield

Date

Yield

3-Nov-2011

8.89

4-Nov-2011

8.79

2012

Previous 10Yr

New 10Yr

Date

Yield

Date

Yield

7-June-2012

8.34

8-June-2012

8.15

More about Kush Sonigara on Google+